To analyze user behavior with heatmaps, you can visualize where visitors focus, click, and scroll on your site, revealing their engagement and hesitation points. Different heatmaps like click, scroll, and move maps help identify which areas grab attention, where users drop off, or if UI elements cause confusion. Combining these insights helps optimize your layout, content placement, and user experience. Keep exploring these tools to uncover deeper insights into how visitors interact with your site.
Key Takeaways
- Heatmaps visualize user interactions, revealing high-engagement areas and navigation patterns on websites or apps.
- Different types (mouse, scroll, click, move, eye-tracking) provide comprehensive insights into user behavior.
- Analyzing heatmaps helps identify UI issues, frustrating elements, and opportunities for content placement optimization.
- Combining heatmaps with session recordings offers deeper context for understanding user intentions and pain points.
- Data-driven decisions based on heatmap analysis improve user experience, engagement, and conversion rates.

Understanding how users interact with your website or app is essential for optimizing their experience, and heatmaps offer a powerful way to visualize this behavior. They transform raw interaction data into clear, color-coded visuals, making it easy to identify which areas attract the most attention and engagement. For instance, mouse heatmaps track cursor movements such as clicks, scrolls, drags, and hovers, showing where users spend their time and how they navigate your pages. These insights reveal hesitation points or frustration areas, indicating where your UX might need improvement. Heatmaps can also help identify false positives or areas where data might be inaccurate, ensuring more reliable insights. Engagement heatmaps, also called attention heatmaps, use color gradients—like blue, green, and red—to show the volume of user interactions. They help you determine the best placement for key UI elements such as headlines, images, and calls-to-action (CTAs). If a CTA isn’t getting enough attention, these heatmaps can confirm whether its position on the page needs to be adjusted. Scroll heatmaps reveal how far users scroll down your pages, exposing if important content is missed or buried too deep. If visitors rarely see your bottom content, you can reorganize your layout to highlight essential information higher up. Error click heatmaps identify spots where users frequently click but encounter errors, exposing UI bugs or confusing elements that hinder user flow. This allows you to fix issues quickly, improving overall user experience. Click heatmaps pinpoint where users are clicking most often, guiding you to optimize button and link placement to increase conversions. Meanwhile, move heatmaps track mouse movements without clicks, uncovering areas that draw user attention or cause confusion—crucial data for refining UI and content layout. AI-generated heatmaps take things a step further by predicting likely user interactions based on historical data, achieving accuracy up to 95%. These tools can forecast where users are likely to focus next, even before they act, enabling preemptive design adjustments. Combining different heatmap types, such as eye-tracking heatmaps that analyze gaze and pupil movement, with session recordings and analytics platforms like Google Analytics, provides a detailed view of user motivations and behaviors. This multi-layered insight helps you make smarter, data-driven decisions. Additionally, understanding resources and tools available for heatmap analysis can further enhance your ability to interpret user behavior effectively.

Game Analytics: Maximizing the Value of Player Data
Used Book in Good Condition
As an affiliate, we earn on qualifying purchases.
As an affiliate, we earn on qualifying purchases.
Frequently Asked Questions
How Accurate Are Heatmaps in Predicting User Intent?
You might wonder how well heatmaps predict user intent. They’re good at showing where users focus and interact, revealing engagement patterns. However, they don’t directly measure intent, especially in early stages or complex behaviors. Combining heatmaps with other analytics, like exit rates and scrolling depth, improves prediction accuracy. Overall, heatmaps are valuable tools but should be used alongside additional data for a clearer picture of user goals.
Can Heatmaps Track Mobile and Desktop User Interactions Simultaneously?
You can track mobile and desktop user interactions simultaneously with heatmap tools like Hotjar and Contentsquare. These tools aggregate data such as clicks, taps, scrolls, and gestures across devices, creating separate heatmaps for each. By differentiating input types and device detection, you gain a unified view of user behavior. This helps you identify usability issues, optimize designs, and understand cross-device user journeys effectively.
What Privacy Concerns Are Associated With Heatmap Data Collection?
When it comes to heatmap data collection, you need to watch your back. Privacy concerns include revealing personal locations, like home or work addresses, through activity patterns. Even anonymized data can be pieced together to identify users, especially with public access and cross-referencing. While options exist to limit exposure, such as private settings or data removal, you should stay informed and cautious to avoid data that’s too hot to handle.
How Do Heatmaps Compare to Other User Behavior Analytics Tools?
You want to know how heatmaps stack up against other user behavior tools. Heatmaps give you quick, visual insights into where users click, scroll, and hover, making it easy to spot engagement patterns. Unlike session recordings, which show detailed user journeys, heatmaps offer a high-level view. When combined with funnel analytics or feedback tools, they provide a well-rounded picture of user behavior, helping you optimize your site effectively.
What Are the Limitations of Using Heatmaps for Conversion Optimization?
Ever wonder if heatmaps tell the whole story? They do show where users click and scroll, but they can hide important details. You might mistake confusion for interest or overlook navigation issues. Heatmaps focus on single pages and don’t reveal user intent or journey. Plus, small data sets or design artifacts can mislead your conclusions. So, don’t rely solely on heatmaps; combine them with other analytics for better conversion insights.
website click and scroll heatmaps
As an affiliate, we earn on qualifying purchases.
As an affiliate, we earn on qualifying purchases.
Conclusion
By understanding user behavior through heatmaps, you gain clear insights into what captures attention and what gets ignored. It’s like having a window into your visitors’ minds, revealing patterns you might never notice otherwise. While data shows where users click and hover, it also highlights areas needing improvement. So, embrace heatmaps—because in the chaos of clicks, clarity emerges, guiding you to create a more engaging, user-friendly experience that keeps visitors coming back.
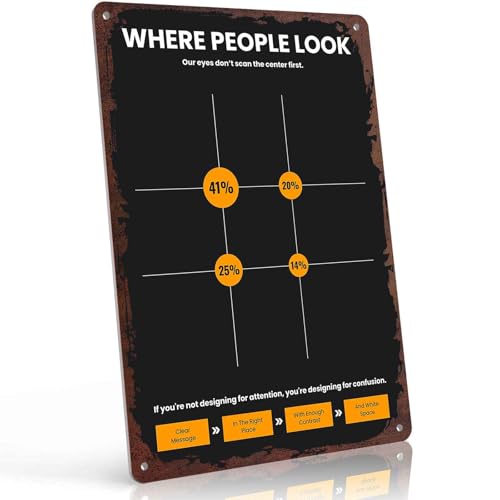
Eye Tracking Heatmap Design Principles Funny Metal Sign 8×12 Inch, Versatile Aluminum Wall Decor, for Home, Office, Bedroom, Living Room – Multi-Purpose Decor
High-Quality Aluminum That Lasts For Years – Tired of wall decor that fades or bends after a short…
As an affiliate, we earn on qualifying purchases.
As an affiliate, we earn on qualifying purchases.
session recording analytics platform
As an affiliate, we earn on qualifying purchases.
As an affiliate, we earn on qualifying purchases.